| A Rectangle or Box is a continuation pattern and describes a price pattern where supply and demand seems evenly balanced for an extended period of time. The currency pair moves in a tight range, finding support at the rectangle's bottom and hitting resistance at the rectangle's top. Finally, price will break out the rectangle's range, either by moving through support or resistance. If the prior trend was an uptrend, the most likely direction will be UP, if the prior trend was a downtrend, the most likely direction will be DOWN. However, rectangle's can become a reversal pattern: if the prior trend was an uptrend and the price breaks through support OR when the prior trend was a downtrend and the price breaks through resistance. What does a Rectangle Formation look like?  The Rectangle pattern is easy identifiable by two parallel lines("Upper end of range" and "Lower end of range"). How to trade this pattern? Always try to trade Rectangle's in the direction of the previous (main) trend: (1) If the previous trend was up, wait for a break out to the upside and go long when the currency pair closes above the upper resistance trendline. Place stop a few pips below the lower support trendline. (2) If the previous trend was down, wait for a break out to the downside and go short when the currency pair closes below the lower support trendline. Place stop a few pips above the upper resistance trendline. Chart example 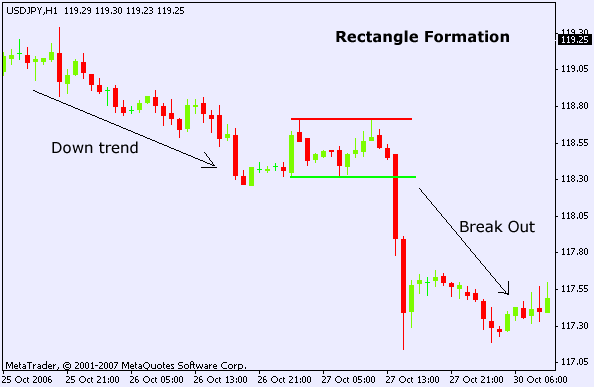 USD/JPY 1 Hour Chart Rectangle continuation pattern. USD/JPY prior trend is down on the chart above, after price breaks the Rectangle's lower support line, it's prior trend resume (DOWN). |
Sunday, December 12, 2010
Forex Rectangle Chart Pattern
Subscribe to:
Post Comments (Atom)
Forex is a good way to invest and increase your wealth. But the whole system sounds quite complex. I have been going through your posts and I hope I understand it better for investment.
ReplyDelete