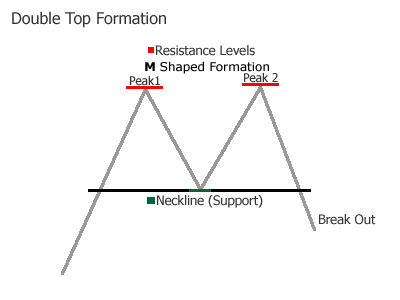
Double Top formations are reversal patterns and often seen to be among the most common (together with double bottom formations) patterns for currency trading. Double Tops are identified by two consecutive peaks of similar (or almost) height with a moderate pull back in between (neckline).
The double top can be a major reversal pattern (if found on a daily chart or bigger timeframe) that can be formed after an extended uptrend. This pattern is confirmed when the currency pair price breaks from (it's second peak) above through the neckline, the most likely price direction is now DOWN.
What does a Double Top Formation look like?

A double top formation is a distinct chart pattern characterized by a rally to a new high (peak1 or resistance1) followed by a moderate pull back (10 -20%) to the neckline (support level) and a second rally to test a new high ( peak2 or resistance2) again.
The two peaks (highs or resistance levels) are at approximately the same price level. What follows is a pull back to below the neck line (support).
How to trade this pattern?

Go short below the Neck Line (support level) when the currency pair price breaks from (it's second peak) above, the most likely price direction is now DOWN. Place your stop couple of pips above the second peak price!
Your target must be at least twice the distance from it's second peak break to the neckline.
Example: If the second peak is at 1.2500 and the neckline is at 1.2425, your target level must be at least 150 pips when trading the break out!
Chart example

GBP/USD 1 Hour Double Top reversal chart pattern
|
|
Thanks for this useful information about Double Chart Pattern. I was in search for this type of information and you have made it easy for me.
ReplyDeleteThese charts are pretty neat. This post is decently elaborated and seems to be written with good and simple English. Thanks for this informative post.
ReplyDelete