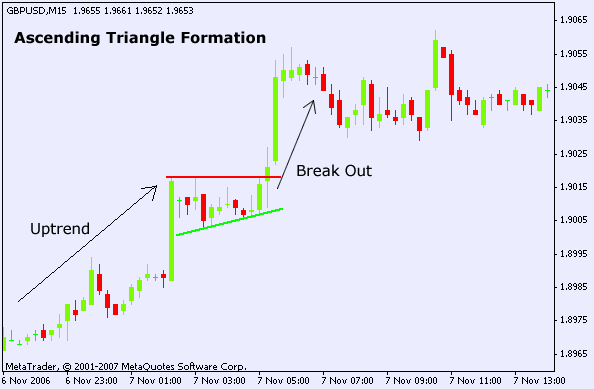
The ascending triangle chart pattern shows two converging trendlines (support levels & resistance levels) and is a bullish formation that usually forms during a currency pair uptrend as a continuation pattern.
This pattern is confirmed when the currency pair price breaks out of the ascending triangle formation to the upside and closes above the upper resistance trendline. However, when the currency pair breaks out to the downside, the ascending triangle now is a reversal pattern.
What does an Ascending Triangle Formation look like?

The ascending triangle is marked by two important trend lines. At its top, there is a line of resistance where traders are selling the currency pair. At it's bottom, we notice the rising support trend line where forex traders are willing to buy the currency pair.
This support line communicates the fact that bullish currency traders are over time willing to pay higher and higher prices for the currency pair indicating a break out to the upside.
How to trade this pattern?
Buy the currency pair when price breaks out of the ascending triangle formation to the upside and closes above the upper resistance trendline.
Chart example

GBP/USD 15 Min Chart Ascending Triangle continuation pattern.
|
|
Hey Everybody,
ReplyDeleteI've created a list of the most recommended FOREX brokers:
1. Most Recommended Forex Broker
2. eToro - $50 min. deposit.
Here is a list of the best forex tools:
1. ForexTrendy - Recommended Odds Software.
2. EA Builder - Custom Strategies Autotrading.
3. Fast FX Profit - Secret Forex Strategy.
I hope you find these lists beneficial.