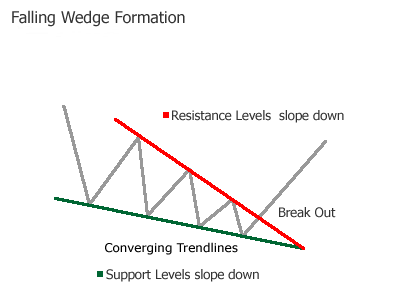
At it's most basic level, Falling Wedge formations are bullish continuation patterns and look similar to triangle patterns (ascending triangle, descending triangle, and symmetrical) because of the converging trendlines( support and resistance) and narrowing price ranges(forms a cone).
Falling wedges slope down and have a bullish bias, they are usually found in up-trending markets.
However, they can become a reversal pattern if the currency pair price move below the lower (support) trendline.
What does a Falling Wedge Formation look like?

How to trade this pattern?
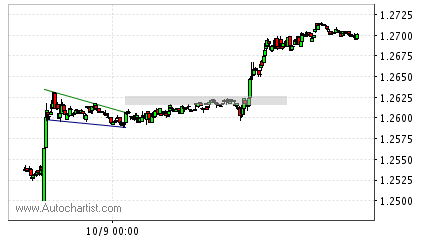
(1) Go long when the currency pair price rises above the upper trendline and place your stop below the lower trendline (support) line. (continuation pattern)
(2) Go short when the currency pair price falls below the lower trendline and place your stop above the upper trendline (reversal pattern)
Chart examples
Falling Wedge Continuation USD/CHF 15 min Chart

Falling Wedge Reversal GBP/USD 240 min Chart

Please Note: This is a falling wedge reversal pattern (price break through the support line)
|
|
Making money online is a great opportunity for people all over the globe! i love the idea of it and i'm a part of it too. the thing i like the most is that you can work from home.
ReplyDeleteMaking money online is a good idea but for that you should have good knowledge of forex market ant the trends in international shares market otherwise it will be a big loss. This article is very informational in that regard.
ReplyDelete