The technique I will describe below is a great opportunity to jump in a trade. The set of rules that I describe can be used as a Forex system. I have heard many names for this technique with the most successful one called the "Pinball Trade". It is the first system I learned and applied successfully during my long trip in Forex research. Experiment with it and see the results on your own. For now let's see how this system is applied.
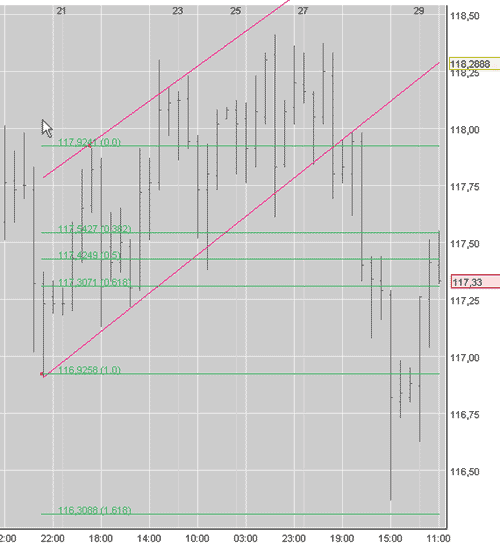
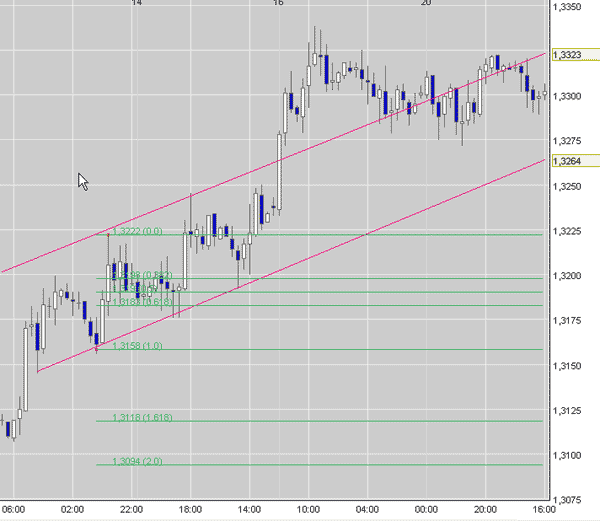
When you recognize an uptrend or a downtrend in Forex charts try to create the channel that includes this trend. When the price hits the one channel line and returns to the other channel line try to see if this line coincides with a Fibonacci retracement level. The price does not necessarily have to hit both the channel lines but the price swing has to be restricted from the channel lines.
This trade setup will give you a high opportunity that the price will reverse (76% of the time according to long term research). Take a good care to design correctly the channel lines and the Fibonacci retracement levels.
If you do not know how to design channel lines see www.easytradeforex.com video tutorials in trendline analysis chapter.
Trade in the direction of the likely reversal. Stop loss orders should be set a little below or above the channel line and Fibonacci retracement level. Look at the images below as real market trading examples of this system.
It is very common for price in Forex to reverse when it has more than one reason to do so. In pinball trade the price reverses because of the channel line with added Fibonacci retracement level. Take good care to design correctly the parallel channel lines. The rest are easy.
Experiment with this technique in Forex charts. At first try to find pinball trades in previous Forex movements. Practice a lot. After getting accustomed to this trade setup you should be ready to apply in your trading. At first recognize a new trend evolving. Draw the channel lines and take the opportunity to use this trade system. You wont be disappointed!
After all these years of trading and research I have learned and used many trading systems. Now I have found that Fibonacci Patterns is the most profitable Forex trading technique for me. You could see more information about this technique in my site at http://www.easytradeforex.com/advanced-fibonacci-patterns-forex-trading-system/
Thank you for sharing your interest with me
Sincerely yours,
Louizos Alexander Louizos
Sunday, December 12, 2010
1-2-3-4 Forex Reversal Trading Strategy
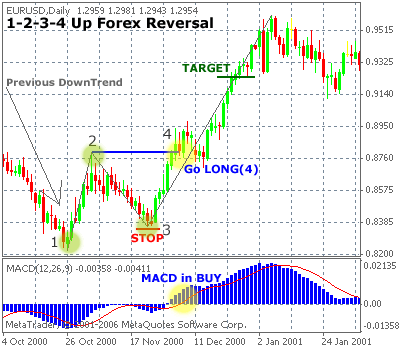
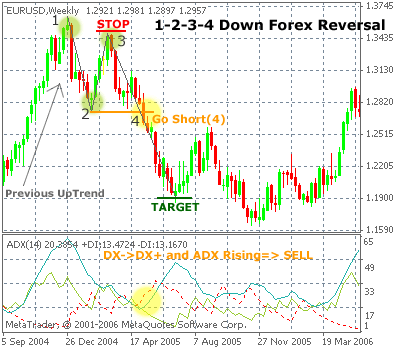
A 1-2-3-4 reversal chart pattern is build up of 4 definable points, known as point 1, 2 , 3 and 4. A typical 1-2-3-4 chart pattern is best traded after a strong currency pair up - or downtrend and can be defined by an easy set of trading rules. A trader can confirm the reversal trade using a technical indicator such as DMI or MACD.
1-2-3-4 Basic Rules for Short Trades
Point (1): The high in an up trending currency market.
Point (2): A downward correction in the up trend, the lowest bar in the correction before the price moves back up to point (3).
Point (3): The high in the move up from Point (2) but a failure to make a new higher high(Point 1).
Point (4): Go short 1 pip below point (2)
1-2-3-4 Basic Rules for Long Trades
The reverse is true when applying these basic rules for long trades but now:
Point (1): The low in a down trending currency market.
Point (2): An upward correction in the downtrend, the highest bar in the correction before the price falls back up point (3).
Point (3): The low in the move down from Point (2) but a failure to make a new lower low(Point 1).
Point (4): Go long 1 pip above point (2)
1-2-3-4 Up Forex Reversal Strategy using MACD
1) Trade this reversal pattern only after a strong downtrend
2) Place points (1),(2) and (3) on your chart
3) Place a BUY order 1 pip above (2)
4) Confirm the trade using the MACD indicator (or another); the MACD must signal a buy or in buy mode already.
5) Target level: Calculate the distance between (2) and (3); if for example the distance between (2) and (3) is 50 pips, than 50 pips is your target level.
6) Place your stop 1 pip below (3)
1-2-3-4 Down Forex Reversal Strategy Using DMI
1) Trade this reversal pattern only after a strong up trend
2) Place points (1),(2) and (3) on your chart
3) Place a SELL order 1 pip below (2)
4) Confirm the trade using the DMI indicator (or another); DMI must signal a sell or in sell mode already.
5) Target level: Calculate the distance between (2) and (3); if for example the distance between (2) and (3) is 250 pips, than 250 pips is your target level.
6) Place your stop 1 pip above (3)
Forex Price Action Trading Strategy
Swing Highs and Lows
The first thing that we need to recognise is what is a Swing High and Swing Low. This is probably the easiest part of price action and bar counting although the whole process gets easier with practice.
I define a swing high as; A three bar combination A bar preceded and succeeded by lower highs | |
I define a swing low as; A three bar combination A bar preceded and succeeded by higher lows |
Market Phases
There are only three ways the market can go;
- Up
- Down
- Sideways
With the swing high/low definition now in mind we can start to build some layers on to the chart to identify these market phases and start to do a simple count of these swing highs and lows.
In short
- The market is going up when price is making higher highs and higher lows
- The market is going down when price is making lower highs and lower lows
- The market is going sideways when price is not making higher highs and higher lows OR lower highs lower lows
This may sound like child's play and a statement of the obvious but you will be surprised at how often people will forget these simple facts. One of the biggest questions I get asked is, which way is the market going? By doing a simple exercise you can see which way that price is going and decide on your trading plan and more importantly timing of a trade.
What do I mean by timing? It may be that you are looking for a shorting opportunity as the overall trend is down but price on your entry time frame is still going up (making HH's & HL's). There is, at this stage, no point in trying to short a rising market until price action start to point down (making LH's & LL's. More on this shortly).
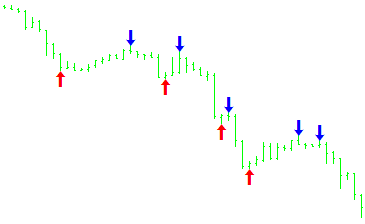
A Short or Bearish Bias Changeoccurs when the following sequence develops. HH>HL>LH>LL>LH The bias change is confirmed when price moves below the las lower low made as highlighted on the chart. Another way of saying this is 123 reversal and you are trading the pullback as your entry trigger (Red Line). There are a few variations of this pattern but this is quite simply a price action bias change in its simplest form. | |
A Long or Bullish Bias Change occurs when the following sequence develops. LL>LH>HL>HH>HL The bias change is confirmed when price moves above the last higher high made as highlighted on the chart. Another way of saying this is 123 reversal and you are trading the pullback as your entry trigger (Blue Line). There are a few variations of this pattern but this is quite simply a price action bias change in its simplest form. |
Trending Price Action
After a bias change has been seen and confirmed, one of the phases that the market can then take is to start trending either up or down depending on the bias change previously.
In the chart below we can see what price ideally looks like when price is trending up and trending down. Each phase shows price making HH's & HL's on its way up and LH's & LL's on its way down.
Ranging Price action
Now this is where the chart can become interesting. By using the price action counting of the swing highs and lows we can know at a very early stage IFprice is going to start to develop range bound activity.
- Price is not making new highs OR new lows
I don't mean all time highs/lows or new day/week/month highs/lows... just simply a new chart swing high or low. Price will start to stall and not make a new swing high/low and typically will stay contained within the last swing high and low that was made on the chart. Isn't that a simple definition?
Range rule definitions
- Price doesn't make a new high or low on the move
- If price stays contained within the last swing high and swing low to be made, price will remain range bound until it makes news move highs or lows.
- Price confirms the range when a lower high and a higher low is made within the previous swing high and low.
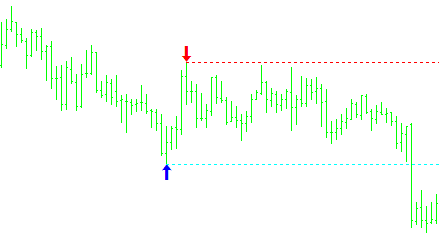
In the chart below you can see that from the left side of the chart price is making LH's & LL's all the way to the first blue arrow which in real time would be the latest lowest low. Price then moves higher to make a HH. These two swing levels have been highlighted.
At the point of the chart, in real time, price needs to either start moving higher past the last swing high (red Arrow) making a new high OR move lower past the last swing low (blue arrow) making a new low. Until either of those things happens price will most likely remain range bound. In this example that is what happened.
Range considerations
Some considerations for identifying ranges at an early stage in real time are;
- That price could be creating a pullback or bias change and as the chart unfolds for you a new high or low could be made voiding the potential range.
- There are several definitions of a range one of the more common ones is that you are looking for a double touchof support and resistance. For me this is a little too late in the game as price may not create the double touch as in the example above. With this price action method you can identify the possibility of a range developing VERYearly without having to worry IF price does or does not give you the double touch. As you can see with that definition you would interpret that price is not range bound at all but, you can clearly see visually that price is moving sideways without any definition.
What you should have learnt from this short article
- A simple rule defined method to identify swing highs and lows
- How to use this swing high/low definition to interpret price action market phases
- How to identify a bias change
- How to identify trending price action
- How to identify Range bound price action
In the below images we can see the pattern variation and compare them to the outlined pattern above. The only main difference is that you are looking for a breach of a previous swing high or low as the first qualifier to indicate a potential bias change.
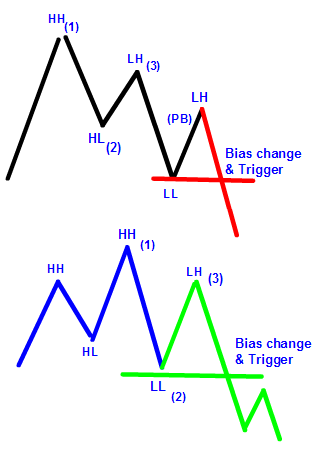
Acronyms used
- HH - Higher High
- HL - Higher Low
- LH - Lower High
- LL - Lower Low
By Philip Newton
www.trading-strategies.info
Philip Newton is a professional trader and teaches new and experienced traders the skills needed to trade for a living. His live chat room is amongst the best in the industry. Inside the members area traders can watch videos of his trades and receive support for any question they may have. The live trading room is the heart of the website where the real learning begins. www.trading-strategies.info
Forex SlingShot 30M Trading Strategy
The forex video's below describe the Slingshot 30 Min trading strategy. It is 100% mechanical and preferred currency pairs to trade are EUR/USD, GBP/USD, USD/CHF and USD/JPY SlingShot strategy keynotes:
Next video shows forex slingshot trading strategy examples for the GBP, JPY and EUR. |
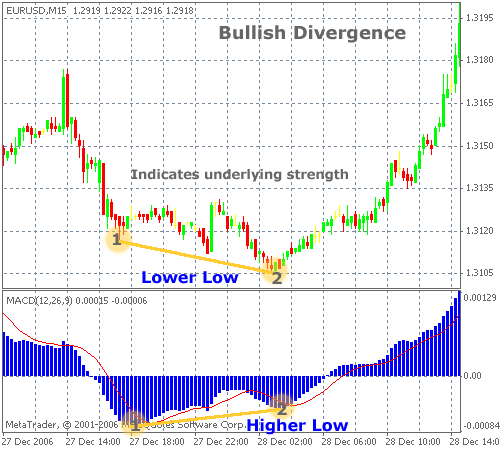
Bullish & Bearish Divergence Pattern
|
Forex Symmetrical Triangle Chart Pattern
|
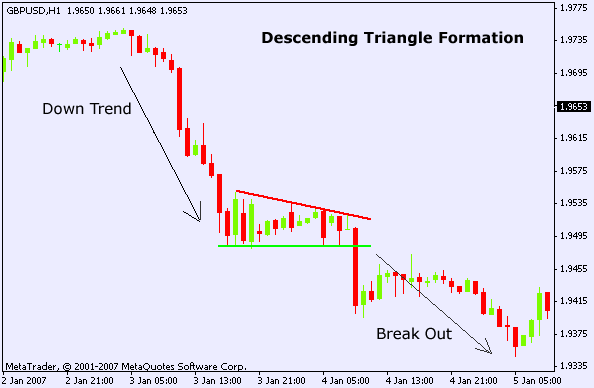
Forex Descending Triangle Chart Pattern
|
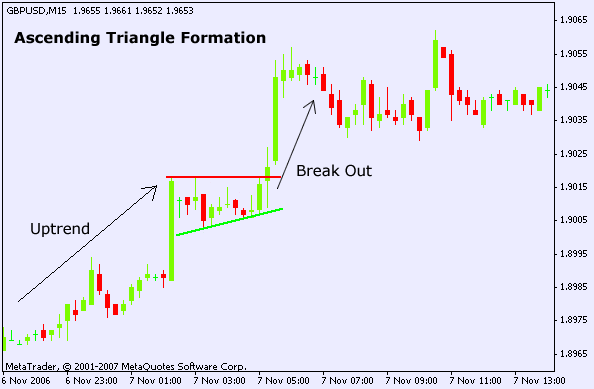
Forex Ascending Triangle Chart Pattern
|
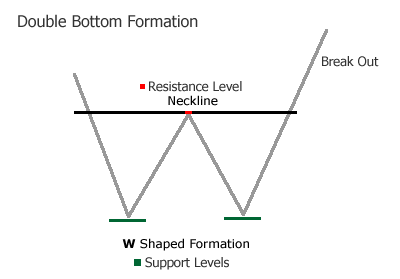
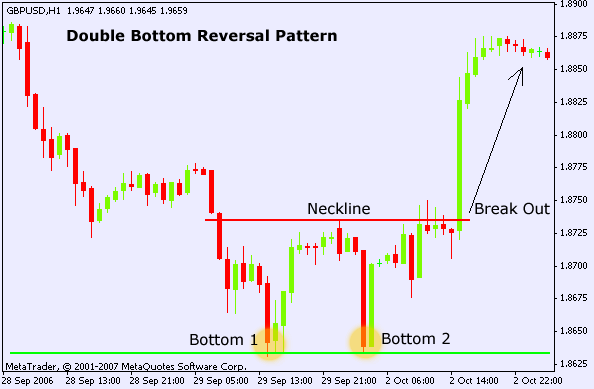
Forex Double Bottom Chart Pattern
|
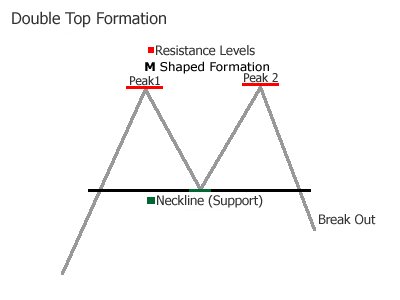
Forex Double Top Chart Pattern
|
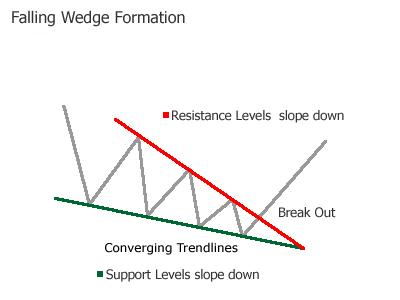
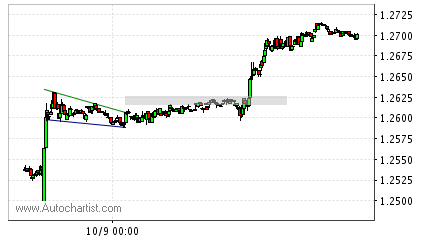
Forex Falling Wedge Chart Pattern
|
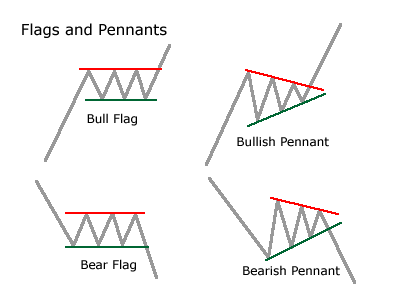
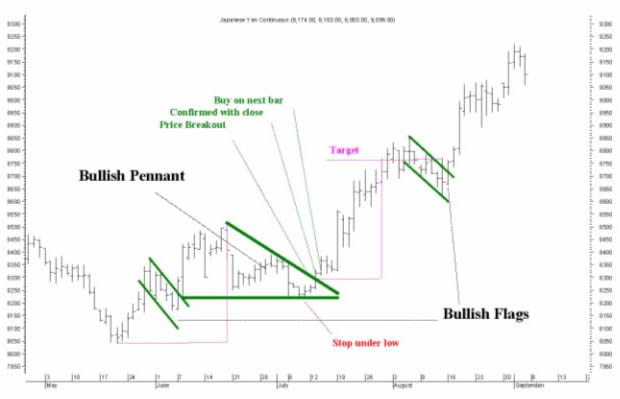
Forex Flags And Pennants Chart Pattern
|
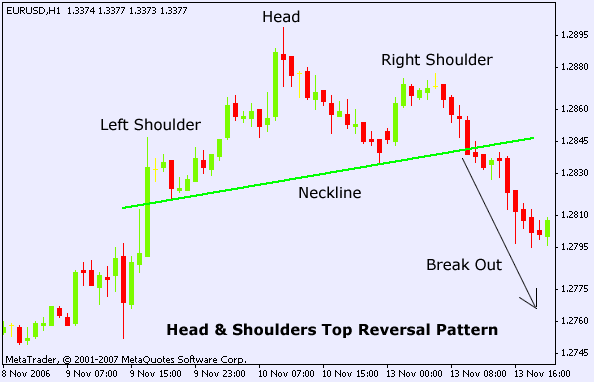
Forex Head & Shoulders Top Chart Pattern
The Head and Shoulders Top marks a "reversal" pattern in an uptrend market and is extremely popular among currency traders. The pattern consists of 2 Shoulders, 1 Head and the Neckline (support): 1) The first point - the left shoulder - occurs as the price of the currency pair in a rising market hits a high and then fall back to the neckline. 2) The second point - the head - happens when prices rise to an even higher high and then fall back again to the neckline. 3) The third point - the right shoulder - occurs when prices rise again but don't hit the high of the head. 4) A key element of the pattern is the neckline and can be horizontal, slope up or slope down and is formed by drawing a line connecting two low price points of the formation. What does a Head & Shoulders Top reversal pattern look like? The pattern is complete when support provided by the neckline is "broken." This occurs when the price of the currency pair, falling from the high point of the right shoulder, moves BELOW the neckline. Currency analysts will often say that the Head & Shoulders top pattern is not confirmed until the currency price closes below the support neckline - it is not enough for it to trade below the support neckline. Please note: The Head & Shoulders Top looks similar to a Head & Shoulders Bottom but reverse. How to trade this pattern?Go short when the currency price CLOSES below the neckline and put a stop-loss few pips above the last peak (right shoulder). Use a risk reward ratio 1.5 or better to calculate your profit target.(if you risk 50 pips, your target should be at least 75 pips). Chart example EUR/USD 1 Hour Head & Shoulders Top reversal pattern Please note that the Head and Shoulders Top formation does not need to be perfectly symmetrical. |
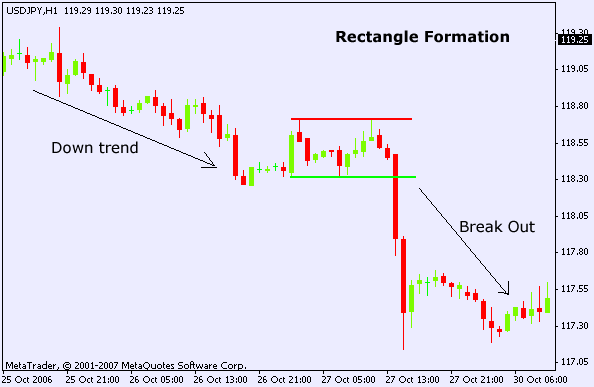
Forex Rectangle Chart Pattern
A Rectangle or Box is a continuation pattern and describes a price pattern where supply and demand seems evenly balanced for an extended period of time. The currency pair moves in a tight range, finding support at the rectangle's bottom and hitting resistance at the rectangle's top. Finally, price will break out the rectangle's range, either by moving through support or resistance. If the prior trend was an uptrend, the most likely direction will be UP, if the prior trend was a downtrend, the most likely direction will be DOWN. However, rectangle's can become a reversal pattern: if the prior trend was an uptrend and the price breaks through support OR when the prior trend was a downtrend and the price breaks through resistance. What does a Rectangle Formation look like? The Rectangle pattern is easy identifiable by two parallel lines("Upper end of range" and "Lower end of range"). How to trade this pattern? Always try to trade Rectangle's in the direction of the previous (main) trend: (1) If the previous trend was up, wait for a break out to the upside and go long when the currency pair closes above the upper resistance trendline. Place stop a few pips below the lower support trendline. (2) If the previous trend was down, wait for a break out to the downside and go short when the currency pair closes below the lower support trendline. Place stop a few pips above the upper resistance trendline. Chart example USD/JPY 1 Hour Chart Rectangle continuation pattern. USD/JPY prior trend is down on the chart above, after price breaks the Rectangle's lower support line, it's prior trend resume (DOWN). |
Forex Rising Wedge Chart Pattern
At it's most basic level, Rising Wedge formations are bearish continuation patterns and look similar to triangle patterns (ascending triangle, descending triangle, and symmetrical) because of the converging trendlines( support and resistance) and narrowing price ranges(forms a cone). Rising wedges slope up and have a bearish bias, they are usually found in down-trending markets. However, they can become a reversal pattern if the currency pair price move above the upper (resistance) trendline. How a Rising Wedge Formation look like? How to trade this pattern? (1) Go short when the currency price falls below the lower trendline and place your stop above the upper trendline (resistance) line. (continuation pattern) (2) Go long when the currency pair price rises above the upper trendline and place your stop below the lower trendline (reversal pattern) Chart examples Rising Wedge Continuation GBP/JPY 60 min Chart Rising Wedge Reversal USD/CAD 30 min Chart Please Note: This is a rising wedge reversal pattern (price break through the upper trendline) |
Forex Triple Bottom Chart Pattern
Triple Bottom formations are reversal patterns with bullish bias, this pattern is not often seen in the forex market (also note Triple Tops, Double Bottoms and Double Tops). Triple Bottoms are identified by three consecutive lows of similar (or almost) height with 2 moderate pull backs up in between (neckline peaks). The triple bottom can be a major reversal pattern (if found on a daily chart or bigger timeframe) that can be formed after an extended downtrend. This pattern is confirmed when the currency pair price breaks from (it's third bottom) below through the neckline, the most likely price direction is now UP. What does a Triple Bottom formation look like? A triple bottom formation is a distinct chart pattern characterized by a rally to a new low (bottom1 or support1) followed by a moderate pull back up (10 -20%) to the neckline (resistance level), a second rally to test a new low ( bottom2 or support2) followed by a moderate pull back up(10 -20%) to the neckline (resistance level) and finally a third rally to test a new low ( bottom3 or support3). The three lows (bottoms or support levels) are at approximately the same price level. What follows is a pull back up to above the neck line (resistance). How to trade this pattern? Go long above the Neck Line (resistance level) when the currency pair price breaks from (it's third bottom) below, the most likely price direction is now UP. Place your stop couple of pips below it's third bottom price! Your target must be at least twice the distance from it's third bottom break to the neckline. Example: If the third bottom price is at 1.2300 and the neckline is at 1.2400, your target level must be at least 200 pips when trading the break out! Chart example USD/JPY Daily Chart Triple Bottom reversal chart pattern |
Forex Triple Top Chart Pattern
Triple Top formations are reversal patterns with bearisch bias, this pattern is not often seen in the forex market (also note Triple Bottoms, Double Bottoms and Double Tops). Triple Tops are identified by three consecutive highs of similar (or almost) height with 2 moderate pull backs in between (neckline).
The triple top can be a major reversal pattern (if found on a daily chart or bigger timeframe) that can be formed after an extended uptrend. This pattern is confirmed when the currency pair price breaks from (it's third peak) above through the neckline, the most likely price direction is now DOWN.
What does a Triple Top formation look like?
A triple top formation is a distinct chart pattern characterized by a rally to a new high (peak1 or resistance1) followed by a moderate pull back (10 -20%) to the neckline (support level), a second rally to test a new high ( peak2 or resistance2) followed by a moderate pull back (10 -20%) to the neckline (support level) and finally a third rally to test a new high ( peak3 or resistance3).
The three peaks (highs or resistance levels) are at approximately the same price level. What follows is a pull back to below the neck line (support).
How to trade this pattern?
Go short below the Neck Line (support level) when the currency pair price breaks from (it's third peak) above, the most likely price direction is now DOWN. Place your stop couple of pips above it's third peak price!
Your target must be at least twice the distance from it's third peak break to the neckline.
Example: If the third peak price is at 1.2300 and the neckline is at 1.2250, your target level must be at least 100 pips when trading the break out!
Chart example
USD/JPY Daily Chart Triple Top reversal chart pattern
What is an indicator
A technical indicator is created by applying a certain formula to the price data of a currency or other financial security. This data can include any combination of the open, high, low, and close over a period of time.
Technical indicators provide traders with a different perspective from which to analyze price action. Technical indicators can be derived from both simple formulas such as moving averages, while others can be more complex such as stochastics. The good news is that you do not need to know how these formulas are applied since the majority of indicators are shown in a graphical format allowing the trader to easily compare it with the corresponding price chart of the currency or security they are analyzing. All forex indicators are presented below:
A
Advance/Decline (A/D) Line
Advance/Decline (A/D) Ratio
Absolute Breadth Index (ABI)
Accumulation Swing Index (ASI)
Accumulation/Distribution (A/D)
Accumulation/Distribution of volume
Advance/Decline Line Breadth
Advancing-Declining Issues
Alligator
Alpha
Alpha Jensen
Andrew's Pitchforks
Arms Index (TRIN)
Aroon Oscillator
Aroon
Average Directional Movement Index (ADX)
Average Directional Movement Rating (ADXR)
Average True Range (ATR)
B
Beta
Bollinger Bands
Bollinger Bands Histogram
Breadth Thrust
C
Candlestick
Chaikin Money Flow
Chaikin Oscillator (CHO)Chaikin Volatility (CHV)
Chande Momentum Oscillator (CMO)
Chaos Gator
Commodity Channel Index (CCI)
Commodity Selection Index (CSI)
CP volumentum trend
Correlation Analysis
Cumulative Volume Index (CVI)
Cutler's RSI
D
DeMarker (DeM)
Detrended Price Oscillator (DPO)
Directional Movement Index (DX)
Disparity index
Displaced MA
Double exponential moving average (DEMA)
Dynamic momentum
E
Ease of Movement
Ehler's Fisher Transform
Elder-rays
Elliot oscillator
Envelope
Exponential Moving Average (EMA)
F
Fast stochastic
Fibonacci Arcs
Fibonacci Fans
Fibonacci phi-Channel
Fibonacci Retracements
Fibonacci Spiral
Fibonacci Studies
Fibonacci Time Goals
Fibonacci Time Zones
Force Index (FRC)
Forecast Oscillator
Four percent model
Full stochastic
H
Haurlan index
Herrick Payoff Index
Historical volatility
I
Ichimoku Kinko Hyo (IKH)
Inertia
Intraday Momentum Index (IMI)
K
Kagi chart
Kairi
Keltner channel
Klinger Oscillator (KO)
L
Linear regression channel
Linear regression indicator
Linear regression slope
Linear Regression Trendline
Linear regression
M
Market Facilitation Index (BW MFI)
Mass Index (MI)
McClellan Oscillator
McClellan Summation
Median Price
MESA Sinewave
Modified moving average
Momentum
Momentum percent %
Money Flow
Money Flow Index (MFI)
Moving Average
Moving Average Convergence/Divergence (MACD)
MACD 2 lines
MACD Histogram
Moving Average Envelope
N
Negative Volume Index (NVI)
New Highs - Lows Cumulative
New Highs - Lows Ratio
New Highs - New Lows
Norton high-low indicator
Notis %V
O
On Balance Volume (OBV)
Open-10 TRIN
Oscillator of moving averages (OsMA)
Overbought/Oversold (OB/OS)
P
Parabolic SAR (pSAR)
Percent change
Percent of resistance (PCR)
Percent R
Percentage Volume Oscillator (PVO)
Polarized Fractal Efficiency (PFE)
Positive Volume Index (PVI)
Price action indicator
Price and Volume Trend (PVT)
Price channel
Price Oscillator
Q
Qstick
R
Random Walk Index (RWI)
Range Expantion index (REI)
Range Indicator
Rate of Change (ROC)
Relative Momentum Index (RMI)
Relative Strength Comparative
Relative Strength Index (RSI)
Relative Volatility Index (RVI)
Ribbon Study
R-squared
S
Schaff trend cycle
Simple Moving Average
Slow stochastic
Speed Lines
Standard Deviation
Standard Deviation Channel
Standard Error
Standard Error Bands
Standard Error Channel
STIX
Stochastic Momentum Index (SMI)
Stochastic Oscillator
Stochastic RSI
Stoller Average range channel (STARC)
Swing Index
T
Ichimoku Kinko Hyo (IKH)
Time Series Forecast
Tom Demark Moving Average
Tom Demark Range Projection
Trade Volume Index
Trend Line
Triangular Moving Average
Triple exponential Moving Average (TEMA)
True Strength Index (TSI)
Typical Price
U
Ultimate Oscillator (UO)
Upside/Downside Ratio
Upside/Downside Volume
V
Variable Moving Average
Vertical Horizontal Filter (VHF)
Volatility
Volume
Volume Accumulation
Volume by price
Volume Oscillator
Volume+
Volume Rate of Change (VROC)
W
Weighted Close
Weighted Moving Average
Welles Wilder RSI
Welles Wilder Smoothing
Welles Wilder Volatility Index
Williams� Accumulation/Distribution (WA/D)
Williams %R
Z
Zig Zag
Subscribe to:
Posts (Atom)